
Analyzing LLY Stock highlights Eli Lilly’s unshakeable dominance in the global pharmaceutical landscape. Powered by its flagship GLP-1 weight-loss and diabetes treatments-Mounjaro and Zepbound-Eli Lilly (NYSE: LLY) has evolved into one of the premier mega-cap compounders of the decade. Institutional investors evaluating healthcare allocations in 2026 are closely monitoring LLY stock as commercial demand continues to outstrip total industry manufacturing capacity.
1. Zepbound & Mounjaro Revenue Surge Outpaces Global Supply
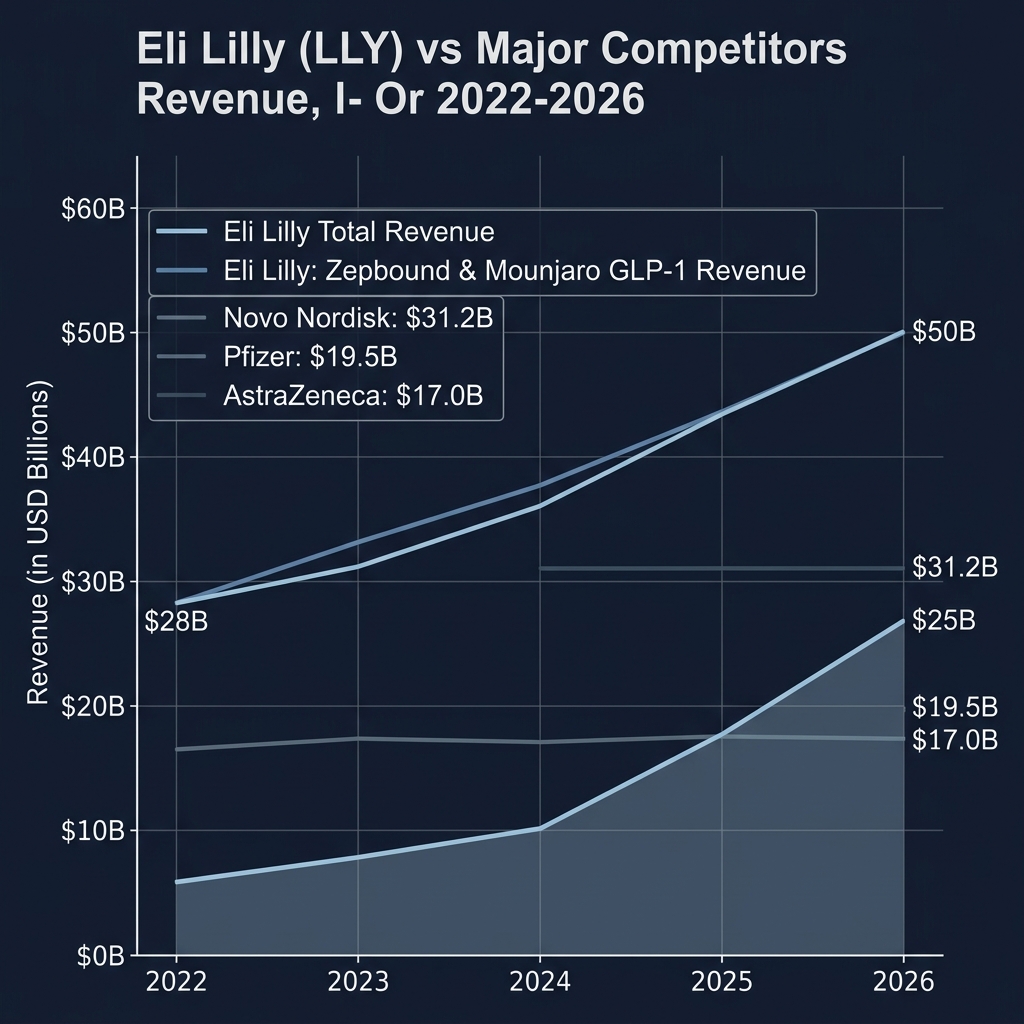
First and foremost, demand for Zepbound (tirzepatide for obesity) and Mounjaro (tirzepatide for type 2 diabetes) represents an unprecedented commercial growth curve in biopharmaceutical history. With insurance coverage expanding rapidly across private payers and Medicare advantage plans, patient adoption has triggered multi-billion-dollar backlogs.
To capture this multi-decade tailwind, Eli Lilly has deployed unprecedented capital expenditure (CapEx) to expand fill-finish manufacturing sites across North America and Europe. As supply bottlenecks clear throughout 2026, volume delivery is projected to drive quarterly revenue acceleration to record highs.
2. Multi-Billion Dollar Pipeline Expansion & Label Additions of Eli Lilly
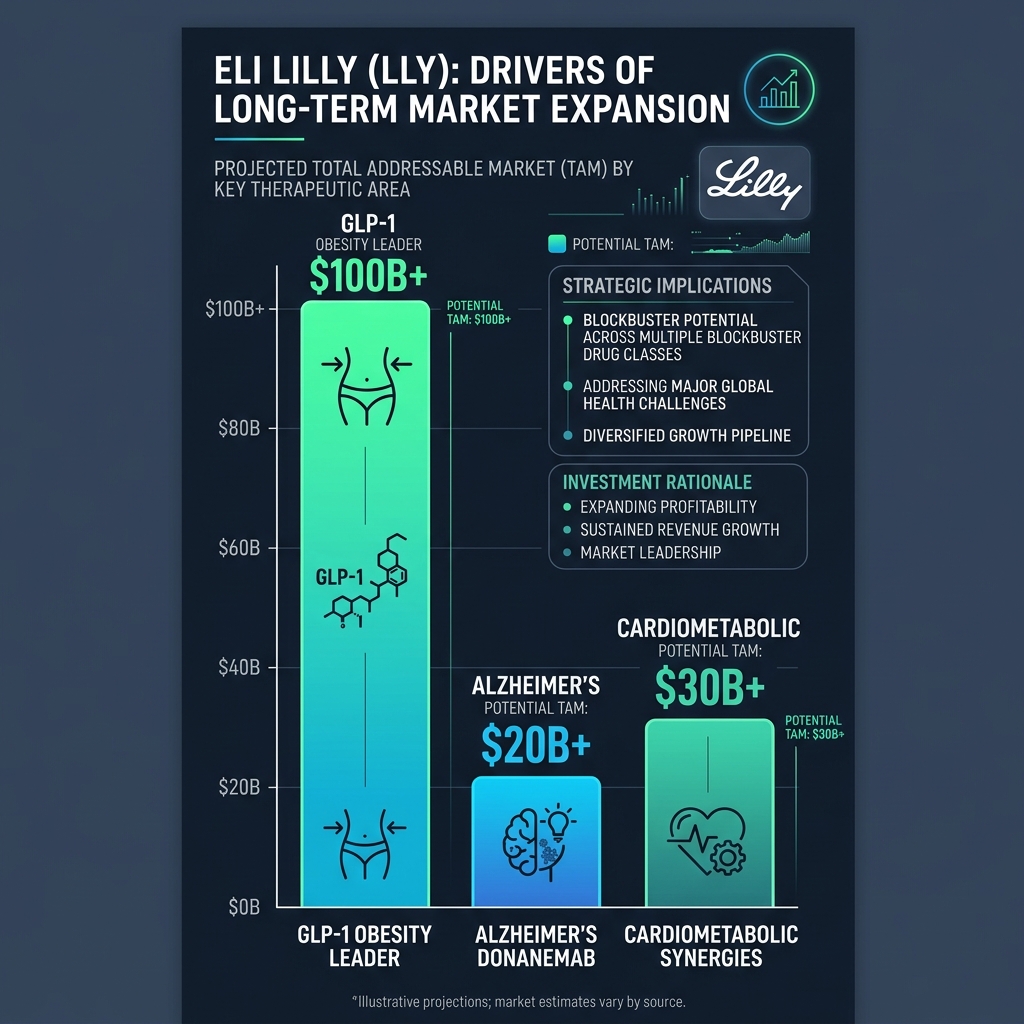
Beyond current obesity and diabetes indications, Eli Lilly’s clinical pipeline provides significant valuation expansion. Clinical trials for tirzepatide have demonstrated landmark efficacy in treating obstructive sleep apnea, heart failure with preserved ejection fraction (HFpEF), and non-alcoholic steatohepatitis (NASH/MASH).
Furthermore, Eli Lilly’s Alzheimer’s therapy, Donanemab, marks a revolutionary breakthrough in clearing amyloid plaque. Obtaining broad regulatory approvals across international markets expands LLY stock’s Total Addressable Market (TAM) by an additional $30B+ over the coming multi-year cycle.
3. Operating Margin Expansion & Free Cash Flow Conversion of Eli Lilly
From a financial valuation perspective, Eli Lilly exhibits best-in-class operating leverage. As commercial sales scale, gross margins exceed 80%, allowing operating margin expansion to flow directly into Free Cash Flow (FCF). This cash generation powers aggressive internal R&D reinvestment while supporting steady dividend growth for institutional shareholders.
While critics cite elevated forward price-to-earnings (P/E) multiples relative to traditional legacy pharma, growth investors recognize that rule-of-thumb multiples understate LLY stock’s compound annual growth rate (CAGR). High revenue visibility, unbreakable patent moats through the 2030s, and high customer retention make LLY a cornerstone asset for core portfolio growth.
Investors seeking additional mega-cap growth ideas should also explore our deep dive on PLTR Stock: Palantir AIP Enterprise Growth as well as our analysis of Berkshire Hathaway’s Record Cash Allocation.
💡 Further Reading for Investors:
Want to master growth stock valuations and competitive moats?
Check out
The Intelligent Investor by Benjamin Graham – https://amzn.to/4huFG8x
One Up On Wall Street by Peter Lynch – https://amzn.to/4huFLJn
The Psychology of Money by Morgan Housel – https://amzn.to/4fWa9d2
Principles for Navigating Big Debt Crises by Ray Dalio – https://amzn.to/4fZGTCl



Pingback: TSLA Stock: 3 Explosive Growth Drivers for 2026
Pingback: META Stock: Why AI & Advantage + Ad Sales Will Surge