

Listen—if you’ve been watching storage tech lately, you’ve probably noticed Seagate (STX) isn’t acting like your typical hardware stock. It’s moving like a story nobody expected to be written.
I’m breaking down what’s really happening with Seagate. And honestly, the data is painting a picture most investors are completely missing.
What’s Actually Happening with STX?
Here’s the thing about Seagate. For years, it was boring. Just another hard-drive maker in a dying industry, right? That narrative has flipped entirely.
Consider this: Seagate just reported full-year fiscal 2025 revenue of $9.10 billion, up 39% year-over-year. But here’s where it gets interesting—net profit surged 339% in the same period. That’s not a typo. That’s a company fundamentally transforming.
Why? Because the world suddenly needed storage again. Not just any storage—massive, dense, reliable storage for data centers powering artificial intelligence.
The AI boom didn’t kill Seagate. It saved it.
The Fundamental Story of STX: More Than Just Numbers
Revenue Growth That Actually Matters
When Seagate says revenue jumped 39%, understand what that means. In fiscal 2025, they pulled in $9.10 billion versus $6.55 billion the year before. That’s real growth, not accounting tricks.
Moreover, this growth came with expanding margins. The gross margin hit 36.9% across the full year. Better still? Operating margins climbed dramatically. These aren’t vanity metrics—they show pricing power and operational efficiency.
Compare this to companies squeezing margins while revenue stagnates. Seagate is doing the opposite. More sales, more profit per sale. That’s the golden combination.
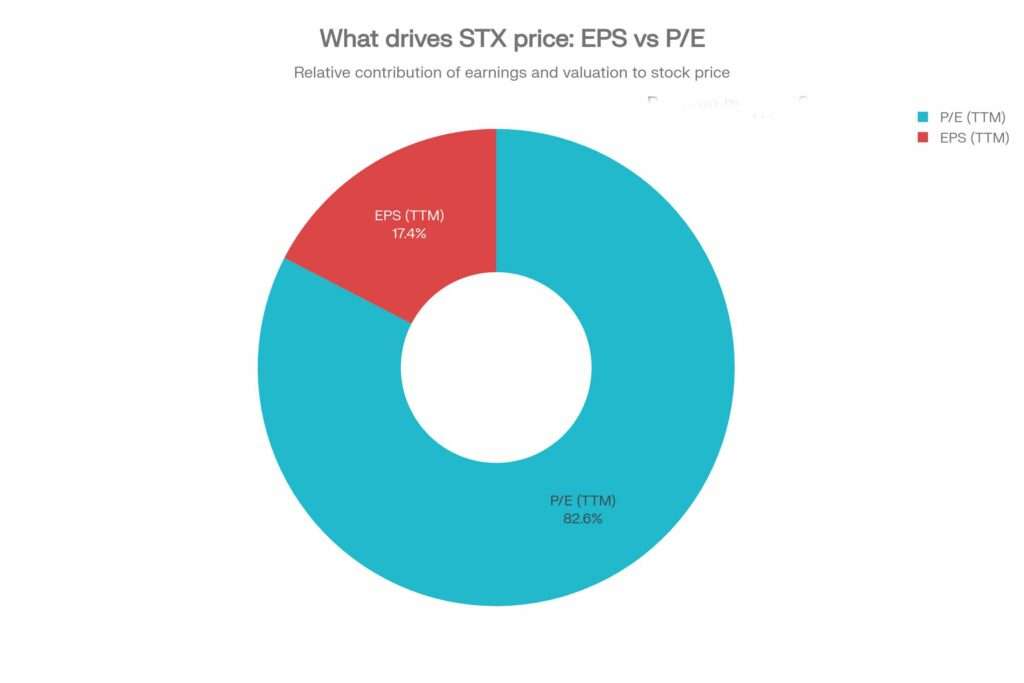
Earnings Per Share: The Real Signal
Earnings per share (EPS) tells you what matters to shareholders. Seagate delivered $6.93 in fiscal 2025 EPS, jumping from $1.60 the previous year. That’s a 433% increase.
Now, here’s the nuance. Much of this came from operational leverage—fixed costs spread across higher revenue. But that’s exactly how mature companies generate sustainable returns. It’s the formula that works.
Q2 fiscal 2026 data (most recent) shows EPS of $3.11, up 19% quarter-over-quarter. The trajectory remains upward. No signs of deceleration.
The AI Supercycle Thesis
This matters more than you think. Major analysts including J.P. Morgan and Morningstar believe we’re in a memory chip and storage supercycle. This isn’t speculation. It’s recognition that data center buildout will sustain for years.
Why does this benefit Seagate specifically? Because enterprise-grade hard drives—particularly high-capacity ones for data centers—command premium pricing. Morgan Stanley recently raised their price target from $270 to $337, citing exactly this thesis.
Technical Analysis: Reading the Chart Like a Pro
Support and Resistance Levels Matter
STX trades around $346 as of late January 2026. Understanding where support and resistance sit tells you what’s likely next.
Key Resistance Levels:
- $355–$360 (immediate resistance)
- $370+ (psychological level, previous highs)
Critical Support Zones:
- $330–$335 (recent breakout area)
- $300–$310 (major support from previous cycles)
- $280–$290 (secondary support)
Here’s what this structure means. If STX holds above $330, the path toward $370+ remains open. If it cracks below $330, weakness accelerates toward $310.
The Overbought Question
The Relative Strength Index (RSI) is currently elevated around 71.81. Technically, that’s overbought territory (above 70). But before you panic-sell, understand the context.
STX has risen 47.83% over three months. That’s extraordinary. Yet the stock remains fundamentally sound. High RSI with strong earnings doesn’t mean crash—it means volatility risk. Big difference.
Stochastic readings at 91.96 also suggest overbought conditions. Translation? A consolidation or pullback becomes likely. It wouldn’t be surprising to see STX correct 10–15% and find support at $300–$315.
Moving Averages Tell the Real Story
All major moving averages (5-day, 10-day, 20-day, 50-day, 100-day, 200-day) are bullish and aligned upward. This is the clearest trend confirmation you can get.
When every timeframe points the same direction, you’re seeing institutional money at work. Retail traders can’t move all those averages. Only serious capital does.
The Valuation Puzzle: Expensive or Justified?
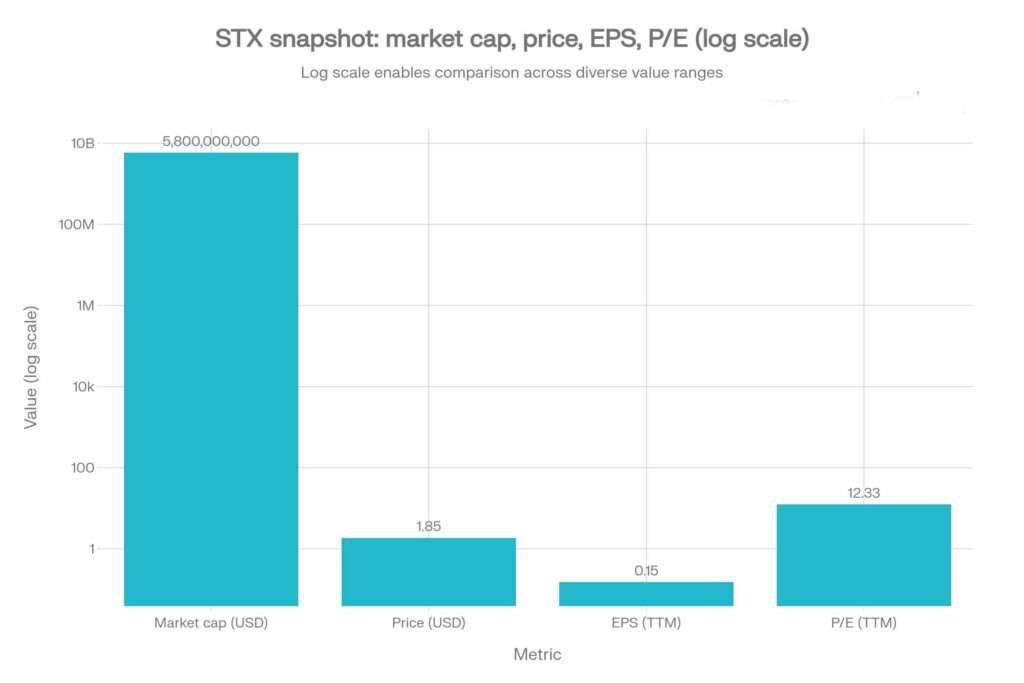
P/E Ratio: Context Is Everything
STX trades at a trailing P/E of approximately 41.5. On the surface, that looks expensive. But forward P/E of 24.5 paints a different picture.
Here’s the distinction. Trailing P/E uses past earnings. Forward P/E uses expected future earnings. Seagate’s forward P/E being so much lower signals analysts expect earnings to keep rising sharply.
Given the supercycle thesis and strong guidance, this makes sense. The market is pricing in growth. Whether that growth actually materializes determines if current valuations hold.
Price-to-Sales and Cash Generation
Price-to-sales (P/S) sits around 7.43, which is elevated. Yet this ignores Seagate’s cash generation capabilities. In fiscal 2025, operating cash flow remained strong. The company returned capital to shareholders through dividends while paying down debt.
This matters because it demonstrates Seagate isn’t just reporting paper profits. It’s generating actual cash. Companies burning cash while showing earnings are red flags. Seagate shows the opposite.
The 2026 Catalyst: What’s Driving This Move
AI Infrastructure Buildout (The Big One)
Data centers need storage. Lots of it. GPUs, processors, networking gear—none of that matters without somewhere to store the data. Seagate provides exactly that.
Goldman Sachs and other institutions have quantified the spending on AI infrastructure for 2026 and beyond. The numbers are staggering. And Seagate is positioned to capture significant market share in high-capacity enterprise drives.
HAMR Technology (High-Angle Magnetic Recording)
HAMR represents the next generation of hard-drive technology. It allows denser data storage on the same physical footprint. Translation? Higher capacity, same size, premium pricing.
Seagate’s HAMR shipments are ramping. This technology commands better margins than conventional drives. As volumes increase, gross margins expand even further.
Pricing Power in a Supply-Constrained Market
Here’s something analysts rarely discuss. Supply chain constraints have created temporary pricing power. But even as supply normalizes, demand remains so strong that pricing can sustain.
When demand exceeds supply, sellers set prices. When supply catches up, pricing usually compresses. Seagate’s advantage is that demand seems durable enough to absorb any normalization.
The Risks (Because Perfection Doesn’t Exist)
Be honest about what could go wrong.
Economic Slowdown: If capex spending by cloud providers stalls, Seagate’s growth halts. Recession risk is real.
Technology Disruption: Solid-state drives (SSDs) continue improving. If SSDs become cost-competitive at scale, HDD demand faces pressure.
Valuation Risk: At $346 with forward P/E above 20, Seagate is priced for perfection. Any earnings miss creates 10–20% downside.
Debt Levels: While improving, Seagate carries debt. Rising interest rates create refinancing challenges.
Where STX Heads in 2026
Based on fundamentals, technicals, and catalysts, Seagate has a base-case target of $350–$390 by mid-2026. Bull-case targets reach $410–$450 if the supercycle narrative intensifies.
Downside risk sits at $300–$310 if the overbought signals trigger a correction.
The Bottom Line
Seagate isn’t just recovering. It’s fundamentally transformed. Revenue growth, margin expansion, EPS surge, and a genuine demand tailwind create a compelling picture.
The technicals show overbought conditions. That’s a warning for traders seeking entries, not a red flag for the thesis.
If you believe in AI’s infrastructure buildout (and institutions clearly do), then Seagate deserves portfolio consideration.
The question isn’t whether Seagate is expensive. The question is whether its earnings growth justifies that valuation. So far, the evidence suggests yes.
👉 You might also find this post insightful – https://bosslevelfinance.com/volkswagen-outsold-tesla-what-smart-investors-do-now
Sources
- https://www.investing.com/news/transcripts/earnings-call-transcript-seagate-q2-2026-beats-expectations-with-strong-eps-93CH-4468
- https://finance.yahoo.com/news/seagate-technology-holdings-full-2025-113937610.html
- https://stockanalysis.com/stocks/stx/
- https://rockflow.ai/stocks/stx/
- https://investors.seagate.com/financials/quarterly-results/default.aspx
- https://www.moneycontrol.com/us-markets/technical-analysis/seagatetechnology/STX/daily
- https://finviz.com/news/271706/seagate-technology-stx-has-risen-around-5-since-the-start-of-2026
- https://www.tipranks.com/stocks/stx/technical-analysis
- https://simplywall.st/stocks/us/tech/nasdaq-stx/seagate-technology-holdings/news/assessing-seagate-technology-holdings-stx-valua
- https://www.investing.com/equities/seagate-technology-technical