

Adani Power has grown fast on revenue and capacity, shows strong operating leverage, and carries mid-20s P/E with improving balance sheet metrics; however, profits are volatile, regulatory and fuel risks persist, and the stock shows mixed technicals near key support and resistance zones, so a step-by-step framework is essential for decisions in 2025. Moreover, capacity additions, higher PLF, and tariff recoveries lifted FY24 results, while recent quarters show normalization, meaning investors should model ranges, not point targets. Additionally, peers trade at varied valuations and have different risk mixes, so comparisons must be apples-to-apples on cash flows, leverage, and regulated revenue visibility. Finally, use prudent sizing, scenario thinking, and periodic rebalancing rather than binary calls in a cyclical utility.
Why Adani Power deserves a fresh look in 2025
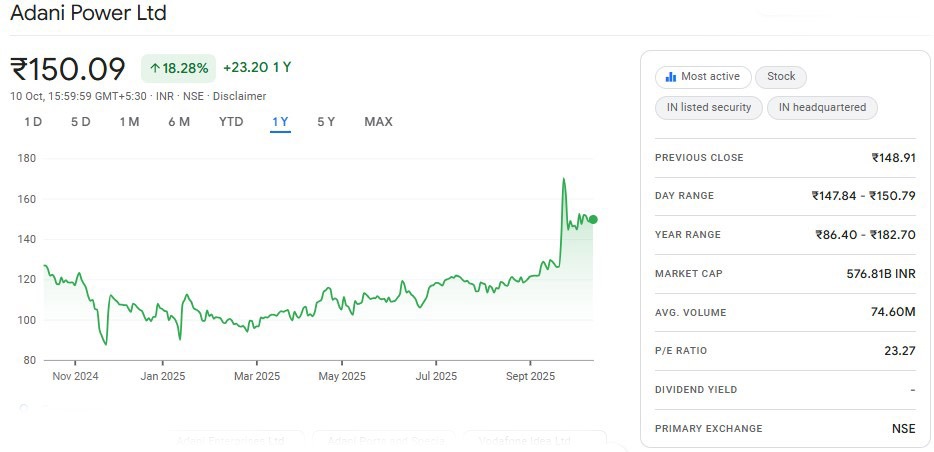
India’s power demand continues to rise, and that secular tailwind supports cash flows across efficient generators with PPA-backed volumes and improving fuel cost pass-throughs. Furthermore, the company has scaled into one of India’s largest private thermal players, which, combined with a tighter cost structure and better PLF, has strengthened earnings in recent years. Moreover, the valuation sits around the mid-20s P/E on trailing earnings, implying the market is pricing in growth, but also some risk. Additionally, the balance of opportunities and risks suggests a “framework-first” approach: analyze capacity, PLF, fuel cost pass-throughs, receivables, and regulatory claims before forming a view.
Adani Power fundamentals: the big picture
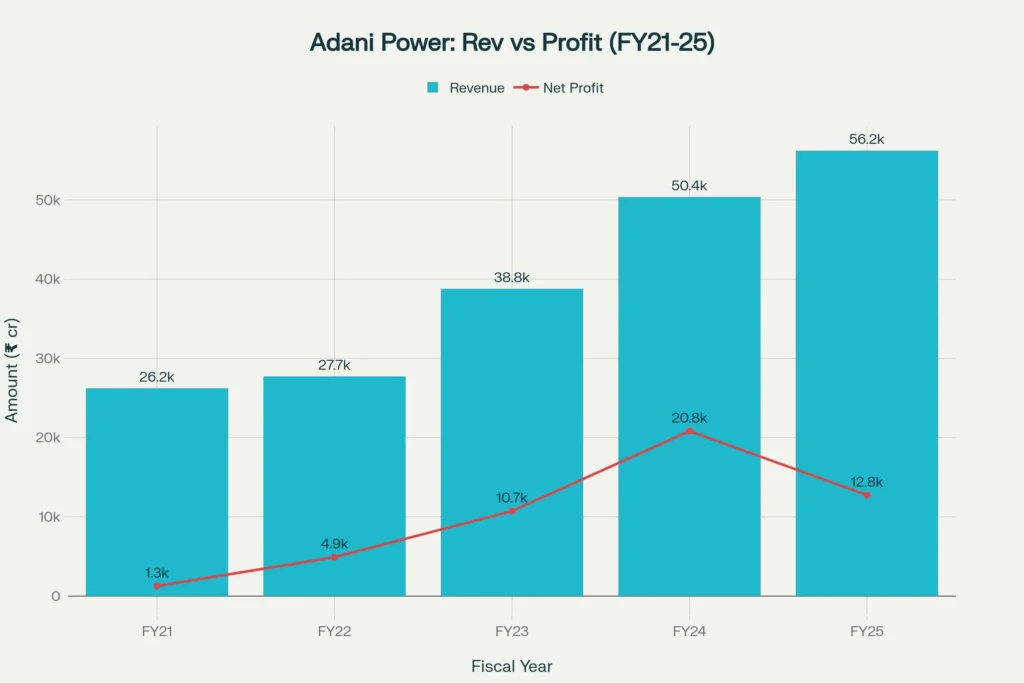
Adani Power’s five-year record shows significant revenue growth, robust operating profit uplift, and improved return ratios versus earlier periods, reflecting operating leverage and scale effects. Moreover, the profit trajectory has been volatile due to fuel, regulatory, and market factors, so trailing numbers should be stress-tested across scenarios. Furthermore, consolidated P&L data points to strong FY24 results, aided by prior-period recoveries and higher contribution from new capacity, followed by normalization trends thereafter. Additionally, short-term dividends remain low as reinvestment and deleveraging often get prioritized in such growth phases.
Adani Power capacity and efficiency trends
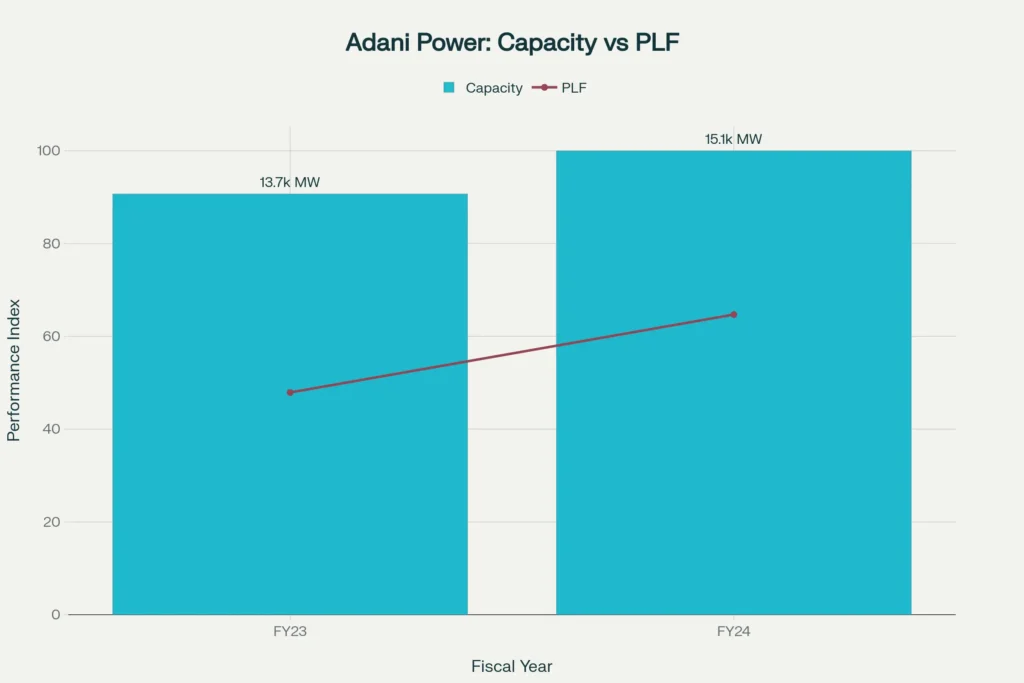
Capacity expansion matters only if it pairs with stronger plant utilization, and that is where PLF becomes crucial to watch. Moreover, the company’s PLF improved meaningfully from FY23 to FY24, reflecting better demand, fuel availability, and operational execution. Furthermore, reported operating capacity increased year over year, and installed capacity as of March 31, 2024, provides a higher base for volume throughput. Additionally, sustained PLF above 60% can stabilize unit economics, support EBITDA, and improve predictability of cash generation.
Valuation snapshot and peer context
On recent snapshots, the stock trades near a mid-20s P/E, with a P/B above 4x, a market cap in the ₹2.8–2.9 lakh crore zone, and a beta above 1.7, signaling higher-than-market volatility. Moreover, relative to peers, the company’s ROCE and ROE have improved versus historical levels, yet the market keeps a risk premium for thermal exposure and regulatory complexity. Furthermore, third-party fundamental scorecards point to solid net margins and improving leverage metrics, while also flagging valuation rich versus certain intrinsic models. Additionally, the mix of long-term PPAs, merchant exposure, receivables, and regulatory receivables should be tracked as they influence cash conversion cycles.
Revenue, EBITDA, and PAT: what the trend suggests
Consolidated financials indicate strong revenue growth over FY21–FY25 alongside a step-up in operating profits, with PAT impacted by one-offs, recoveries, and fuel-cost dynamics. Moreover, FY24 saw outsized benefits from prior-period recoveries and capacity addition, but investors should normalize such effects when building forward estimates. Furthermore, EBITDA gains have been driven by higher volumes, improved tariff realizations, and better PLF, which together reflect both macro demand and micro execution. Additionally, modeling a base, bull, and bear case on revenue and PAT helps anchor expectations and sizing amid cyclical swings.
Adani Power technicals: levels and momentum
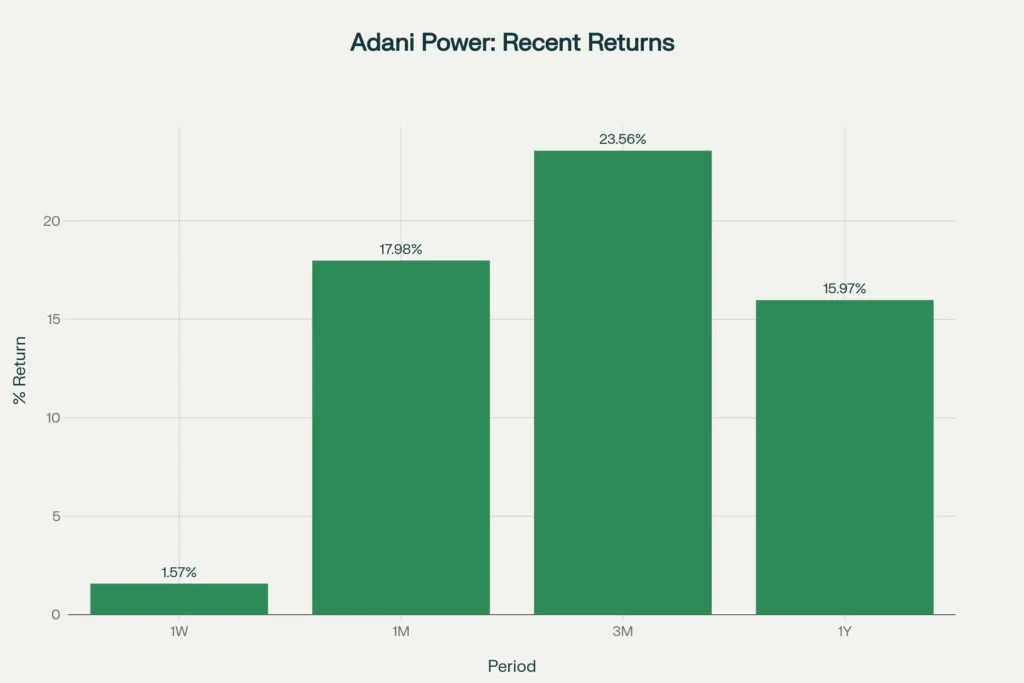
Price is not value, yet price action signals timing; recent snapshots show bullish longer-term trends with clear resistance clusters and layered supports. Moreover, short-term oscillators and moving-average summaries can flip quickly around events, so use them as signals, not gospel. Furthermore, key supports often sit near recent moving averages, while resistance bands cluster near previous swing highs, creating defined trade zones. Additionally, one-week to one-year return snapshots confirm the stock’s volatile, momentum-driven character—use risk controls if trading around positions.
Risk dashboard: what can go wrong
Thermal exposure means sensitivity to coal availability, global prices, pass-through mechanisms, and environmental norms, all of which can swing margins. Moreover, regulatory decisions and timing of recoveries can shift quarterly and annual earnings materially, thus affecting valuation multiples. Furthermore, receivables, working capital cycles, and counterparty credit quality remain important for cash flow durability. Additionally, market-wide risk-off phases can compress multiples across cyclicals, regardless of fundamentals, so portfolio context matters.
Opportunity set: what could go right
If PLF holds above 60%, demand stays firm, and fuel pass-throughs continue to work, the operating leverage can sustain healthier EBITDA. Moreover, capacity additions and better load factors can lift utilization, stabilizing returns on capital, and supporting deleveraging. Furthermore, any structural progress on receivables and regulatory recoveries can improve cash conversion and reduce the valuation risk premium. Additionally, policy support for reliable baseload and grid stability can underpin steady run-rate volumes for efficient operators.
A simple, practical research framework for 2025
First, focus on four drivers: capacity, PLF, fuel cost pass-through, and receivables; these explain most earnings variance for a thermal utility. Moreover, check the mix of long-term PPAs versus merchant volumes and monitor tariff realizations versus input costs each quarter. Furthermore, map near-term capex and debt schedules against internal accruals to gauge funding needs and interest cost risks. Additionally, review third-party scorecards for corroboration, but always revert to primary financial statements and management disclosures.
How to apply this to your personal plan
If you prefer steady wealth building, consider blending this stock analysis with money systems that reduce stress and improve outcomes. Moreover, use long-tail, low-competition search habits for personal finance learning, such as “best high-yield savings accounts under $1k,” and then automate transfers toward those goals. Furthermore, if you are building cash buffers, explore ideas like “how to save $5000 in 6 months” with strict budgeting and weekly reviews. Additionally, if you need extra cash flow, try “side hustles for introverts 2024” to add a low-stress income stream while you research equities.
Position sizing, entries, and discipline
For investors, position sizes of 3–7% per single cyclical can reduce regret and allow room for error while you learn the business cycle. Moreover, for entries, consider scaling in near support zones and scaling out near resistance bands to manage emotions and protect gains. Furthermore, maintain a rebalancing rule: trim exposure after large run-ups, and add only when your thesis still holds and risk is controlled. Additionally, always separate trading from investing rules; what works for momentum may not suit long-term compounding.
Conclusion and clear disclaimer
In 2025, the core thesis is simple: rising demand, better PLF, and disciplined balance-sheet moves can support earnings, but volatility and policy risk require a plan, not hope. Moreover, use data, track drivers, and avoid all-or-nothing bets; compounding comes from many small, sensible decisions, not one perfect call. Furthermore, build scenarios, size prudently, and keep cash buffers so that volatility becomes opportunity, not panic. Additionally, remember that the stock market rewards patience, process, and risk management more than predictions.
👉 You Might also find this post insightful – https://bosslevelfinance.com/iex-stock-2025-key-growth-and-risks-to-watch
👉 Create a Vested Account today to start investing in US Stocks – https://refer.vestedfinance.com/RUKU88007
This is only analysis and education; we do not encourage anyone to buy, sell, or hold any security based on this post; markets change fast, and you must do your own due diligence and, ideally, consult a qualified advisor. Moreover, past performance does not guarantee future results; invest only what you can afford to lose and always use a margin of safety.
Sources (for further reading):
- Screener company financials and P&L (Adani Power, consolidated)screener
- Economic Times live metrics, returns, and analyticseconomictimes.indiatimes
- Angel One operational update and PLF/capacity summaryangelone
- MarketScreener technical trends and levelsmarketscreener
- Smart-Investing valuation snapshot (TTM)smart-investing
- TopStockResearch profitability and stability highlightstopstockresearch
- TradingView technical summary overviewtradingview
- https://www.screener.in/company/ADANIPOWER/consolidated/
- https://economictimes.indiatimes.com/adani-power-ltd/stocks/companyid-23479.cms
- https://www.angelone.in/news/share-market/adani-power-analysis-operational-financial-growth-insights
- https://www.topstockresearch.com/rt/Stock/ADANIPOWER/FundamentalAnalysis
- https://www.smart-investing.in/main.php?Company=ADANI+POWER+LTD
- https://in.marketscreener.com/quote/stock/ADANI-POWER-LIMITED-9059969/graphics/
- https://in.tradingview.com/symbols/NSE-ADANIPOWER/technicals/
- https://www.moneycontrol.com/india/stockpricequote/power-generationdistribution/adanipower/AP11
- https://ticker.finology.in/company/ADANIPOWER
- https://www.equitypandit.com/historical-data/adanipower
- https://dhan.co/stocks/adani-power-ltd-technical-analysis/
- https://www.nseindia.com/get-quotes/equity?symbol=ADANIPOWER
- https://www.moneycontrol.com/financials/adanipower/balance-sheetVI/ap11
- https://in.investing.com/equities/adani-power-technical
- https://finance.yahoo.com/quote/ADANIPOWER.NS/history/
- https://dhan.co/stocks/adani-power-ltd-fundamental-analysis/
- https://www.moneycontrol.com/technical-analysis/adanipower/AP11
- https://www.bajajfinserv.in/analysis-of-adani-power
- https://investyadnya.in/stock-o-meter/adani-power
- https://groww.in/stocks/adani-power-ltd