

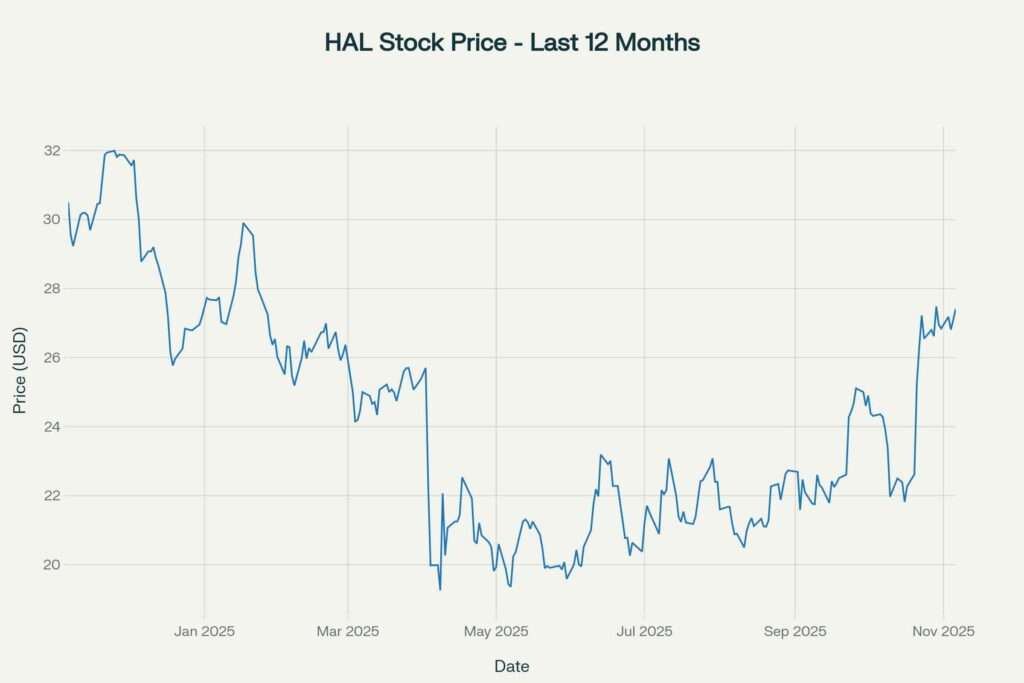
Halliburton stands as the world’s second-largest oilfield services company. Based in Houston with dual headquarters in Dubai, this energy giant specializes in everything from drilling to hydraulic fracturing. Currently, the stock trades around $27.42, down from $30.50 a year ago. However, recent analyst upgrades and growing Middle East operations suggest potential opportunities ahead. Moreover, the company’s P/E ratio sits at 18.13, while industry peers trade higher. This analysis breaks down whether this energy services leader deserves your attention as we head into 2025.

Understanding the Business Model of Halliburton
Halliburton operates through two powerful segments that drive revenue. First, the Completion and Production division focuses on hydraulic fracturing and well completion services. Second, the Drilling and Evaluation segment provides drilling-related services and formation analysis. Together, these divisions generated $22.9 billion in revenue during 2024. Furthermore, the company serves clients across over 70 countries worldwide.
The Completion and Production segment contributed approximately 57.75% of total revenue in 2024. This division remains crucial because it handles fracking operations. Fracking helps extract oil and gas from underground rock formations. Meanwhile, the Drilling and Evaluation segment brought in 42.25% of revenues. This segment assists companies in finding and evaluating oil deposits.
Geographically, North America represents the largest market at 41.95% of total revenue. Additionally, the Middle East and Asia contribute 26.6%. Latin America adds 18.35%, while Europe, Africa, and CIS regions make up 13.09%. Consequently, this global presence provides stability during regional downturns.

Breaking Down the Financial Performance of Halliburton
The third quarter of 2024 revealed mixed results for the company. Total revenue reached $5.7 billion, showing a slight decline from $5.8 billion in Q2. Net income came in at $571 million, or $0.65 per share. However, adjusted earnings stood at $0.73 per share after excluding special charges.
Several factors impacted Q3 performance negatively. Specifically, a cybersecurity incident disrupted operations temporarily. Also, hurricanes in the Gulf of Mexico delayed some projects. These events cost the company approximately $0.02 per share in earnings. Despite these challenges, management maintained operational efficiency.
Operating margins remained healthy at 15% in Q3 2024. This demonstrates strong cost management even during difficult periods. Moreover, the company generated solid cash flow throughout the year. Cash flow supports dividend payments and strategic investments in technology.
For the full year 2024, revenue totaled $22.9 billion. This matched 2023 levels despite industry headwinds. Operating income decreased to $3.8 billion from $4.1 billion in 2023. Nevertheless, the company adapted to changing market conditions effectively.
Halliburton’s Regional Performance Analysis
North America experienced a 4% revenue decline in Q3 2024. Reduced pressure pumping activity in U.S. land operations drove this decrease. Additionally, Gulf of Mexico operations faced hurricane-related disruptions. However, artificial lift activity increased in U.S. land areas. This partially offset the declines.
The Middle East and Asia region showed impressive growth. Revenue increased 3% sequentially in Q3 2024. Saudi Arabia led this growth with increased pressure pumping services. Kuwait also contributed through higher completion tool sales. Furthermore, improved fluid services across the Middle East boosted results.
Latin America faced a 4% revenue decline in Q3. Lower stimulation activity across the region impacted results negatively. Mexico and the Caribbean saw decreased testing services. Argentina experienced reduced wireline activity. Nonetheless, drilling services improved in Mexico and Brazil.
Europe and Africa revenues dropped 5% sequentially. North Sea drilling services decreased significantly. West Africa saw lower completion tool sales. Still, cementing activity increased in the North Sea. Pipeline services also improved in this region.
Valuation Metrics Worth Considering
The current P/E ratio stands at approximately 18.13 based on recent data. This represents a reasonable valuation compared to historical averages. Industry comparisons show mixed signals. Some energy service peers trade at lower multiples. Others command higher valuations based on growth prospects.
The price-to-book ratio currently sits around 1.73. This indicates investors pay $1.73 for every dollar of book value. Compared to the industry average, this seems fairly valued. Book value represents the company’s net assets after subtracting liabilities.
Dividend yield currently hovers around 2.48%. This provides modest income for investors seeking steady cash returns. The company maintains a reasonable payout ratio of approximately 24%. This suggests dividends remain sustainable even during industry downturns.
Analysts maintain generally positive views on the stock. Many rate it as a “buy” or “hold.” Price targets range from $24 to $43 per share. The average target implies potential upside from current levels. However, these targets vary based on oil price assumptions.
Technical Chart Patterns of Halliburton
Recent technical indicators show mixed signals for traders. Moving averages suggest a neutral to slightly bullish trend. The stock trades above several key moving averages currently. This indicates underlying support at lower price levels.
The Relative Strength Index (RSI) reads around 67.86. This places the stock in neutral territory. Neither overbought nor oversold conditions exist presently. Therefore, technical traders see room for movement in either direction.
MACD indicators recently turned bullish. This suggests positive momentum may build in coming weeks. However, some oscillators show bearish signals. Stochastic indicators point to potential selling pressure near term.
Support levels appear around $20.50 to $19.60. These represent prices where buying interest typically emerges. Resistance levels sit near $26.74 to $27.00. Breaking above resistance could signal stronger upward momentum.
Growth Drivers and Opportunities
International expansion remains a key growth driver. Middle East countries continue investing heavily in oil production. Saudi Arabia plans to maintain high output levels. This creates sustained demand for oilfield services.
Technology investments provide competitive advantages. The company developed LOGIX automated geosteering systems. These systems improve drilling precision and reduce costs. Furthermore, iCruise intelligent fracturing platforms optimize well performance.
Energy transition initiatives create new opportunities. While focusing on traditional energy, the company explores cleaner technologies. Carbon capture and geothermal energy represent potential growth areas. These sectors could provide revenue diversification over time.
Efficiency improvements drive margin expansion. Automation and digitalization reduce operational costs. Real-time data analytics optimize resource allocation. Consequently, these improvements enhance profitability even with flat revenues.
Risk Factors to Consider
Oil price volatility represents the biggest risk factor. Lower oil prices reduce exploration and production spending. This directly impacts demand for oilfield services. Therefore, monitoring crude oil trends remains essential.
North American market weakness poses challenges. U.S. shale activity has moderated from peak levels. Pressure pumping demand decreased in recent quarters. Additionally, natural gas prices remain depressed. This affects drilling activity in gas-producing regions.
Competition intensity continues increasing across the sector. Schlumberger remains the largest competitor globally. Other players also compete aggressively for market share. Price competition can pressure margins during downturns.
Geopolitical tensions create operational uncertainties. Middle East operations face potential disruption risks. Regulatory changes in various countries impact business conditions. Currency fluctuations also affect international revenue translation.
Investment Considerations
This analysis provides information for educational purposes only. Stock markets remain subject to constant change and volatility. Therefore, investors should conduct their own thorough research. Never rely solely on any single analysis or recommendation.
Consider your personal financial situation carefully. Risk tolerance varies significantly among individuals. Investment goals and time horizons differ for each person. Consequently, what works for one investor may not suit another.
This analysis does not constitute investment advice. We do not encourage buying, selling, or holding any stock. Professional financial advisors can provide personalized guidance. They consider your complete financial picture before making recommendations.
Market conditions change rapidly and unpredictably. Economic factors influence energy stocks significantly. Interest rates, inflation, and GDP growth all matter. Additionally, regulatory changes impact industry dynamics regularly.
Final Thoughts
The company demonstrates resilience despite recent challenges. Strong international operations offset North American weakness. Technology investments position the company for future growth. Moreover, reasonable valuation metrics suggest potential value.
However, significant risks remain in the energy sector. Oil price volatility creates uncertainty for all players. Competition and geopolitical tensions add complexity. Therefore, careful consideration of all factors proves essential.
Investors should monitor several key indicators going forward. Watch oil price trends and rig count data. Track Middle East project announcements closely. Furthermore, observe quarterly earnings for operational improvements.
The stock may appeal to value-oriented investors. Those seeking dividend income might find it attractive. However, growth investors may prefer other opportunities. Ultimately, individual circumstances determine investment suitability.
Remember that all investments carry inherent risks. Energy stocks experience higher volatility than many sectors. Diversification across multiple investments reduces overall portfolio risk. Never invest money you cannot afford to lose.
Stay informed about industry developments continuously. Read quarterly earnings reports and analyst commentaries. Follow energy market news from reliable sources. Additionally, consider joining investment communities for diverse perspectives.
👉 You Might also find this post insightful – https://bosslevelfinance.com/spotify-hits-new-highs-whats-driving-the-stock
Do your own due diligence before making any investment decisions. This analysis represents one perspective among many available. Multiple viewpoints help form balanced investment opinions. Take time to research thoroughly before committing capital.
👇REFERRAL LINKS👇
👉Referral link for Groww – https://app.groww.in/v3cO/dqzy2ejb
👉Referral link for Zerodha – https://zerodha.com/open-account?c=HWR050
👉Referral link for Vested (For investing in US market) – https://refer.vestedfinance.com/RUKU88007
Sources
- https://www.marketbeat.com/instant-alerts/halliburton-nysehal-stock-rating-upgraded-by-rothschild-redb-2025-11-05/
- https://finance.yahoo.com/news/halliburton-hal-recent-share-price-061135681.html
- https://www.nasdaq.com/articles/halliburton-reports-third-quarter-2024-financial-results
- https://www.halliburton.com/en/about-us/press-release/halliburton-announces-third-quarter-2024-results
- https://en.wikipedia.org/wiki/Halliburton
- https://bullfincher.io/companies/halliburton-company/revenue-by-segment
- https://bullfincher.io/companies/halliburton-company/revenue-by-geography
- https://dcfmodeling.com/blogs/health/hal-financial-health
- https://fullratio.com/stocks/nyse-hal/pe-ratio
- https://www.halliburton.com/en/about-us/press-release/halliburton-announces-fourth-quarter-2024-results
- https://www.tradingview.com/symbols/NYSE-HAL/technicals/
- https://companiesmarketcap.com/halliburton/pe-ratio/
- https://finance.yahoo.com/quote/HAL/key-statistics/
- https://www.marketbeat.com/instant-alerts/halliburton-nysehal-stock-rating-upgraded-by-rothschild-redb-2025-11-05/
- https://finance.yahoo.com/news/halliburton-hal-recent-share-price-061135681.html
- https://www.barchart.com/story/news/35913092/do-wall-street-analysts-like-halliburton-stock
- https://www.investing.com/news/analyst-ratings/halliburton-stock-rating-initiated-at-buy-by-rothschild-redburn-93CH-4326236
- https://www.marketbeat.com/instant-alerts/filing-machina-capital-sas-sells-35190-shares-of-halliburton-company-hal-2025-11-05/
- https://www.marketbeat.com/instant-alerts/filing-freestone-capital-holdings-llc-acquires-new-position-in-halliburton-company-hal-2025-11-05/
- https://www.marketbeat.com/instant-alerts/filing-state-of-michigan-retirement-system-has-581-million-holdings-in-halliburton-company-hal-2025-11-05/
- https://in.investing.com/equities/halliburton-co
- https://finance.yahoo.com/news/halliburton-q3-2024-financial-results-123659884.html
- https://www.weforum.org/organizations/halliburton-company/
- https://in.tradingview.com/symbols/NYSE-HAL/
- https://www.nasdaq.com/articles/halliburton-reports-third-quarter-2024-financial-results
- https://en.wikipedia.org/wiki/Halliburton
- https://companiesmarketcap.com/inr/halliburton/stock-price-history/
- https://www.halliburton.com/en/about-us/press-release/halliburton-announces-third-quarter-2024-results
- https://www.britannica.com/money/Halliburton
- https://www.morningstar.com/stocks/xnys/hal/quote
- https://news.alphastreet.com/infographic-halliburton-hal-q3-2024-revenue-and-profit-decline-yoy/
- https://www.halliburton.com/en/about-us
- https://www.digrin.com/stocks/detail/HAL/price
- https://bullfincher.io/companies/halliburton-company/revenue-by-segment
- https://bullfincher.io/companies/halliburton-company/revenue-by-geography
- https://dcfmodeling.com/blogs/health/hal-financial-health
- https://pdf.dfcfw.com/pdf/H2_AN202501141641916040_1.pdf
- https://www.halliburton.com/en/about-us/press-release/halliburton-announces-fourth-quarter-2024-results
- https://fullratio.com/stocks/nyse-hal/pe-ratio
- https://www.moneycontrol.com/us-markets/technical-analysis/halliburton/HAL/daily
- https://csimarket.com/stocks/segments.php?code=HAL
- https://companiesmarketcap.com/halliburton/pe-ratio/
- https://www.ifcmarkets.co.in/en/technicals/stocks-technical-analysis/halliburton
- https://www.marketscreener.com/quote/stock/HALLIBURTON-COMPANY-69136/finances-segments/
- https://companiesmarketcap.com/inr/halliburton/pe-ratio/
- https://www.marketscreener.com/quote/stock/HALLIBURTON-COMPANY-12871/graphics/
- https://finbox.com/DB:HAL/explorer/pe_ltm/
- https://www.tradingview.com/symbols/NYSE-HAL/technicals/
- https://ng.investing.com/pro/WBAG:HAL/explorer/pe_ltm
- https://in.investing.com/equities/halliburton-co-candlestick
- https://finance.yahoo.com/quote/HAL/key-statistics/
- https://www.barchart.com/stocks/quotes/HAL/technical-analysis
- https://simplywall.st/stocks/us/energy/nyse-hal/halliburton/valuation