
SCHD continues to surprise investors with its resilience during market turbulence. Furthermore, this dividend powerhouse has shown remarkable stability while delivering consistent income growth. Nevertheless, recent price swings have left many wondering if this ETF still deserves its stellar reputation.
SCHD Performance: The Surprising Truth
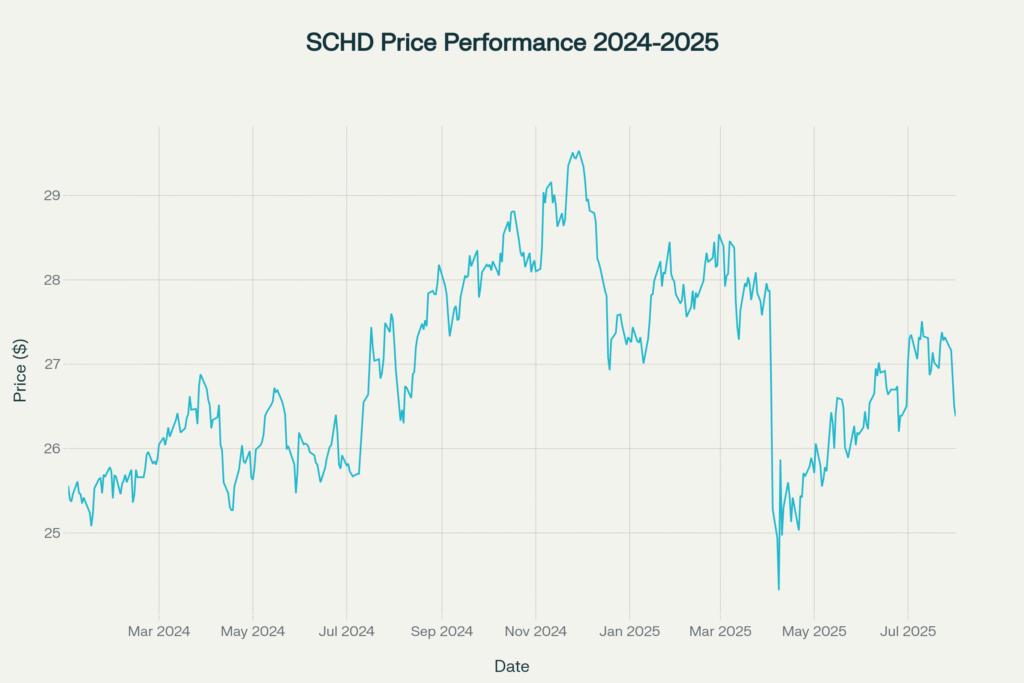
Initially, it started 2024 at approximately $25.56 per share. Subsequently, the ETF climbed to an impressive high of $29.72 in November 2024. However, market volatility sent prices tumbling to $23.87 in April 2025. Currently, trades around $26.38, representing a modest 3.21% year-to-date gain.
Key Metrics That Matter
Notably, It exhibits low volatility at just 0.93% daily. Additionally, the ETF’s 11.24% decline from peak levels demonstrates reasonable downside protection. Moreover, recent 30-day performance shows a slight -1.20% dip, indicating temporary weakness.
Dividend Analysis: The Income Champion
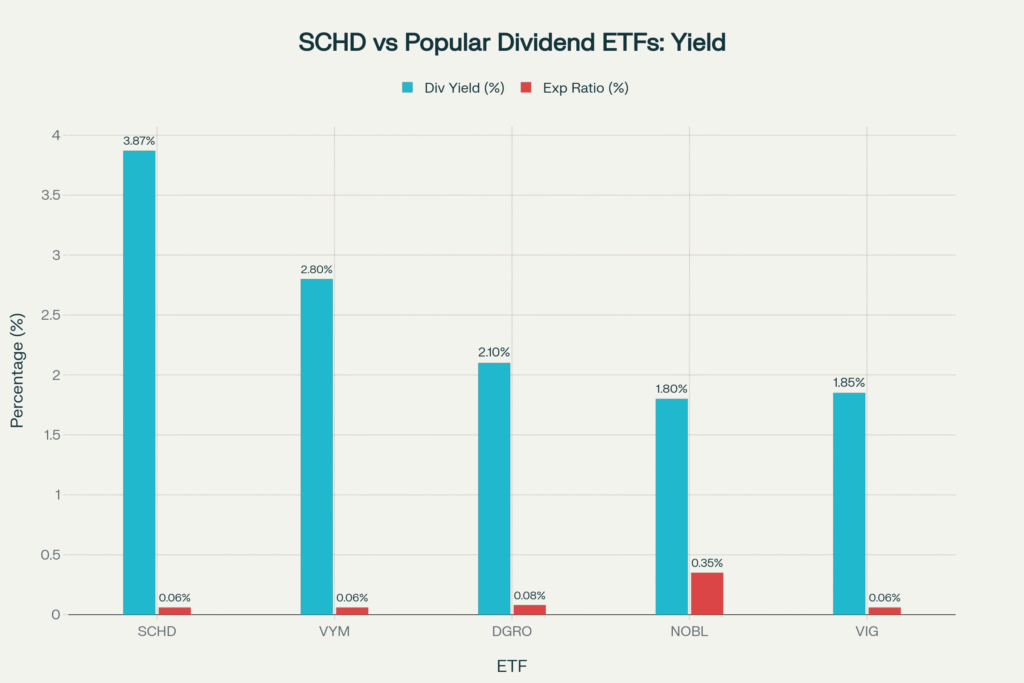
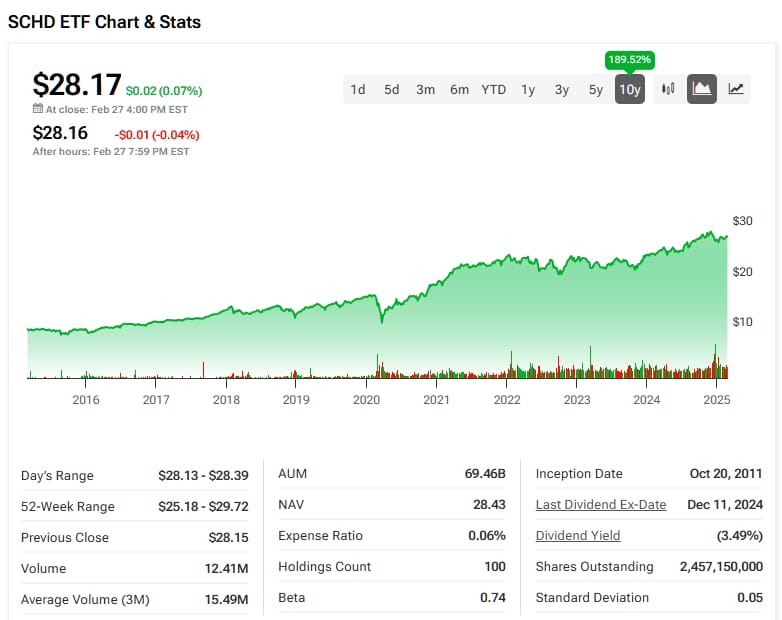
Remarkably, it boasts a compelling 3.87% dividend yield, significantly outpacing many competitors. Consequently, investors receive approximately $1.03 annually per share. Furthermore, the ETF has increased dividends consistently for over 12 years since inception.
SCHD vs Competing ETFs
Impressively, it outshines popular alternatives like VYM (2.8% yield) and VIG (1.85% yield). Similarly, its ultra-low 0.06% expense ratio matches industry leaders. Therefore, investors keep more of their returns compared to higher-cost alternatives.
Fundamental Analysis: Why it Works
Essentially, it tracks the Dow Jones U.S. Dividend 100 Index with surgical precision. Additionally, the fund employs strict quality screens including cash-flow ratios and dividend sustainability metrics. Moreover, individual positions are capped at 4% for proper diversification.
Portfolio Composition Secrets
Strategically, it focuses on large-cap dividend aristocrats with proven track records. Meanwhile, the ETF excludes REITs entirely, concentrating on traditional dividend-paying sectors. Furthermore, quarterly rebalancing ensures optimal weightings across 103 carefully selected holdings.
Chart Analysis: Technical Outlook
Technically, it demonstrates strong support around the $26.00 level. Additionally, resistance appears near $28.50 based on recent trading patterns. Furthermore, the 14-day RSI suggests neither overbought nor oversold conditions currently exist.
Support and Resistance Levels
Currently, it faces immediate resistance at $27.50-28.00. Conversely, strong support exists near $25.50-26.00. Therefore, a breakout above $28.50 could target $30.00 in coming months.
SCHD Investment Case: Why Consider This Fund
Primarily, it offers exceptional value through its combination of yield and growth potential. Additionally, the fund’s quality-focused approach reduces downside risk during market corrections. Moreover, consistent dividend increases provide inflation protection over time.
Growth Catalysts
Notably, it benefits from renewed focus on dividend-paying stocks amid economic uncertainty. Furthermore, rising interest rates favor value-oriented dividend strategies. Therefore, these trends position the ETF for continued outperformance.
Risk Assessment: What Could Hurt
However, it faces headwinds from potential economic slowdowns affecting dividend sustainability. Additionally, sector concentration in energy and financials creates vulnerability to specific industry downturns. Furthermore, rising bond yields might reduce dividend stock attractiveness.
Market Environment Challenges
Similarly, aggressive growth stock rallies could overshadow dividend strategies temporarily. Moreover, inflation concerns might pressure companies to reduce dividend payouts. Therefore, investors should monitor these macroeconomic factors carefully.
SCHD Future Prospects: Expert Perspectives
Generally, financial analysts maintain positive outlooks for quality dividend ETFs like SCHD. Specifically, the fund’s track record and methodology inspire confidence among institutional investors. However, performance expectations remain modest compared to growth-focused alternatives.
Long-term Income Potential
Ultimately, the appeal lies in its steady income generation and capital preservation qualities. Moreover, the fund’s 12.33% annualized return since inception demonstrates consistent wealth building. Therefore, income-focused investors find compelling value in this strategy.
Final Verdict: Evaluating SCHD Today
In summary, It presents an attractive proposition for dividend-seeking investors despite recent price volatility. Particularly, the fund’s quality screening process, low costs, and consistent dividend growth support long-term ownership. However, growth-oriented investors might prefer alternatives with higher return potential.
You Might also find this post insightful – https://bosslevelfinance.com/amd-s-epic-journey-why-this-chip-giant-could-beam-into-your-portfolio
Important Disclaimer: This analysis is for educational purposes only and does not constitute investment advice. We do not encourage users to buy, sell, or hold any securities. Stock markets are subject to change and involve significant risks. Please conduct your own due diligence and consult with qualified financial professionals before making investment decisions.
Sources:
- https://stockanalysis.com/etf/schd/dividend/
- https://in.tradingview.com/symbols/AMEX-SCHD/analysis/
- https://finance.yahoo.com/news/vym-vs-schd-better-etf-175010586.html
- https://www.schwabassetmanagement.com/products/schd
- https://seekingalpha.com/symbol/SCHD/dividends/yield
- https://www.youtube.com/watch?v=xtCpDuiFdxk
- https://www.youtube.com/watch?v=mhSwXjaVvbI
- https://www.morningstar.com/etfs/arcx/schd/portfolio
- https://www.reddit.com/r/dividends/comments/1i8w53b/alternatives_to_schd/
- https://stockanalysis.com/etf/schd/
- https://www.nasdaq.com/market-activity/etf/schd/dividend-history
- https://www.morningstar.com/funds/top-high-dividend-etfs-passive-income-2025
- https://totalrealreturns.com/n/SCHD
- https://etfdb.com/etf/SCHD/
- https://www.justetf.com/en/how-to/dividend-etfs-world.html
- https://www.justetf.com/en/market-overview/the-best-etfs-last-year.html
- https://www.youtube.com/watch?v=I680z44hSxo
- https://finance.yahoo.com/quote/SCHD/performance/
- https://www.morningstar.com/etfs/arcx/schd/performance
- https://www.schwab.com/research/etfs/quotes/news/SCHD