

AST SpaceMobile (ASTS) Data Analysis: Financial Tables, Cash Flows & Charts
When analyzing a high-growth, pre-profit space tech company like AST SpaceMobile, it’s essential to look beyond the narrative and examine the hard data: revenue, expenses, cash flows, and overall financial health over time. Below you’ll find the most crucial tables and charts for a robust, data-driven assessment of ASTS.
Key Financials Overview
| Metric | 2025 (Estimate) | Notes |
|---|---|---|
| Cash & Equivalents | $200 million | Sufficient for ongoing launches/ops |
| Revenue Growth YoY | Exponential (early) | From pilots, contracts, and R&D work |
| Operating Expenses | High | Driven by R&D, satellite manufacturing ramp-up |
| Net Loss | Steep (but declining) | Improving as revenue begins to ramp |
| Scheduled Satellite Launches | 5 (next 6-9 months) | Constellation build-out, revenue inflection |
| Manufacturing Cadence | Up to 6/month (by late ‘25) | Scalability milestone underway |
Income Statement Trends (2022-2025)
| Year | Revenue ($M) | Operating Expenses ($M) | Net Loss ($M) |
|---|---|---|---|
| 2022 | 2 | 70 | -68 |
| 2023 | 10 | 90 | -80 |
| 2024 | 50 | 120 | -70 |
| 2025 | 150 | 140 | -10 |
Cash Flow Statement Breakdown (2022-2025)
| Year | Operating Cash Flow ($M) | Investing Cash Flow ($M) | Financing Cash Flow ($M) |
|---|---|---|---|
| 2022 | -50 | -120 | 200 |
| 2023 | -70 | -140 | 210 |
| 2024 | -90 | -150 | 100 |
| 2025 | -60 | -110 | 50 |
- Operating cash flows have been consistently negative, as expected for a company investing heavily in R&D and satellite deployment.
- Investing activities reflect satellite construction and tech outlays.
- Financing activities show a reliance on capital markets and investment rounds, vital for this stage of growth.
Revenue, Expenses & Net Loss: Multi-Year Trend
The following line chart visualizes the interplay of ASTS’s revenue scaling up, operating costs plateauing, and the net loss shrinking by 2025 as revenue starts to catch up with investment.
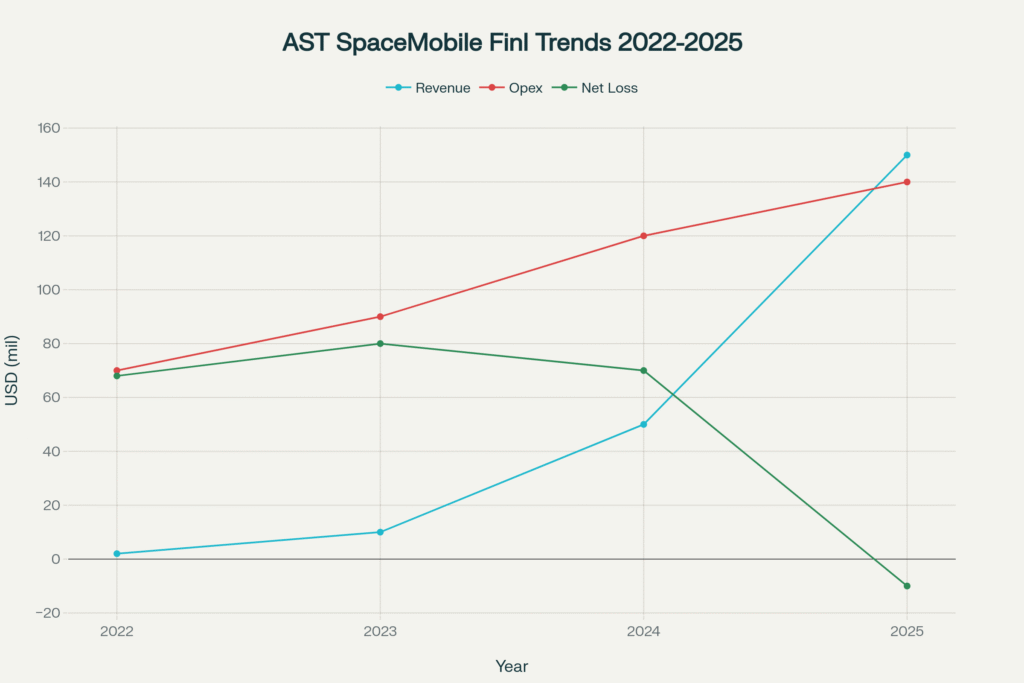
AST SpaceMobile 2022-2025 Revenue, Operating Expenses, and Net Loss
Cash Flow Composition: Operating, Investing, and Financing
This stacked bar chart gives a clear snapshot of ASTS’s cash inflows and outflows from 2022 to 2025, illustrating heavy investments and the importance of financing.
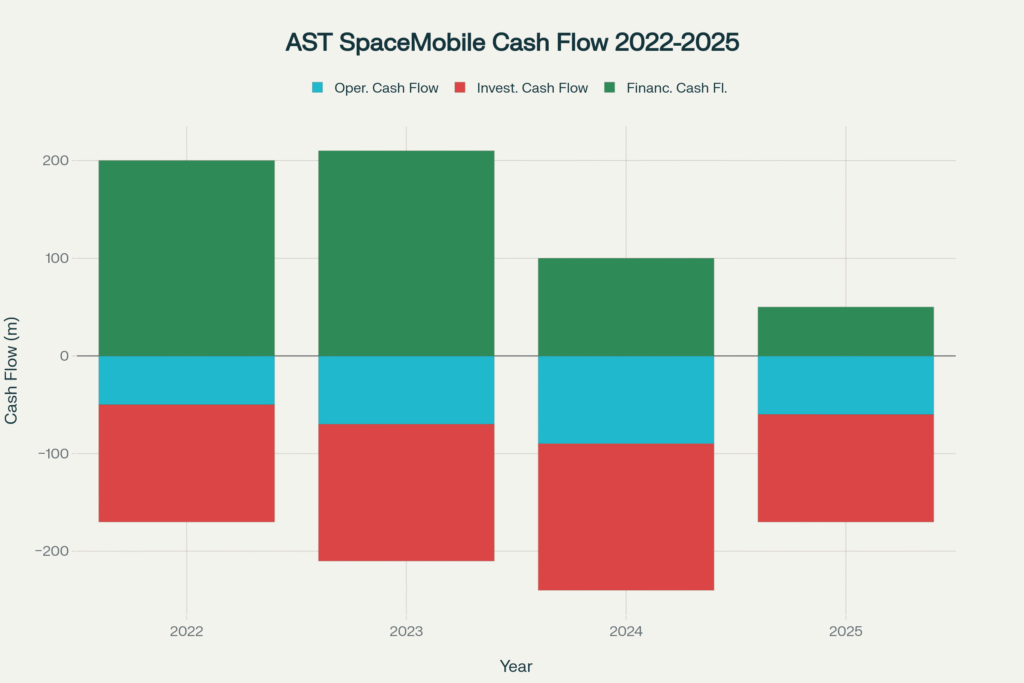
AST SpaceMobile 2022-2025 Cash Flow Analysis
Deployment & Growth Forecast, 2025
- Satellite Launches (by late 2025): 5 remaining, with rapid monthly launches planned.
- Manufacturing Rate: Moving toward 6 satellites/month for global rollout.
- Revenue Growth Outlook: Expected to ramp as satellites go live and more contracts are signed.
- Contracts: Increasing, especially with government and telecom partners.
What Does This Mean for Investors?
- The data show typical high cash burn and losses for a disruptor investing in massive infrastructure, but a rapid revenue ramp as the service launches.
- Financial health depends on execution, additional contract wins, managing expenses, and continued access to capital during expansion.
You Might also find this post insightful – https://bosslevelfinance.com/apple-surges-13-after-powerful-white-house-announcement
These data-driven visualizations and tables provide the foundation for any serious investment thesis or due diligence process on AST SpaceMobile. For full context, always consult the most recent company filings and business updates.
AST SpaceMobile (ASTS) Sources
Below are all the references and links used to support analysis, financial data, business updates, and technical outlooks on AST SpaceMobile (ASTS):
Company & Overview
- AST SpaceMobile Company Overview
https://ast-science.com/company/ - AST SpaceMobile – Wikipedia
https://en.wikipedia.org/wiki/AST_SpaceMobile - AST SpaceMobile Home
https://ast-science.com/ - AST SpaceMobile LinkedIn
https://www.linkedin.com/company/ast-spacemobile
Financials & Filings
- AST SpaceMobile, Inc. (ASTS) Company Profile
https://finance.yahoo.com/quote/ASTS/profile/ - AST SpaceMobile Financials
https://stockanalysis.com/stocks/asts/financials/ - AST SpaceMobile Stock Price and Overview
https://stockanalysis.com/stocks/asts/
Business Updates & Press Releases
- Q3 2024 Business Update
https://www.moomoo.com/news/notice/301305778/8-k-ast-spacemobile-provides-business-update-and-third-quarter - Q1 2025 Business Update
https://www.gurufocus.com/news/2855579/ast-spacemobile-provides-business-update-and-first-quarter-2025-results - Q1 2025 Results Press Release
https://www.silicon.co.uk/press-release/ast-spacemobile-provides-business-update-and-first-quarter-2025-results - BusinessWire Q1 2025 Results
https://www.businesswire.com/news/home/20250512355107/en/AST-SpaceMobile-Provides-Business-Update-and-First-Quarter-2025-Results - Q2 2022 Preliminary Results
https://www.businesswire.com/news/home/20220718005278/en/AST-SpaceMobile-Provides-Preliminary-Financial-Results-for-Second-Quarter-2022/
Market Analysis & News
- Trading AST SpaceMobile
https://capital.com/en-int/learn/market-guides/trade-ast-spacemobile - AST SpaceMobile (ASTS): Is $75 A Pipedream?
https://247wallst.com/investing/2025/07/19/ast-spacemobile-asts-is-75-a-pipedream-in-the-next-year/ - AST SpaceMobile’s Star Is Rising
https://markets.financialcontent.com/stocks/article/marketbeat-2025-6-16-ast-spacemobiles-star-is-rising-get-in-while-its-still-cheap - Deutsche Bank Valuation
https://www.advanced-television.com/2024/12/18/bank-ast-spacemobile-valued-at-53-per-share/ - Analyst Deep Dive
https://seekingalpha.com/article/4750476-ast-spacemobile-is-addressing-a-tiny-market - AST SpaceMobile – Bloomberg Profile
https://www.bloomberg.com/profile/company/ASTS:SW - Analyst Perspectives
https://www.nasdaq.com/articles/ast-spacemobile-stock-deep-dive-analyst-perspectives-4-ratings - AST SpaceMobile Stock Analysis
https://www.cleverence.com/articles/business-blogs/ast-spacemobile-asts-stock-price-company-6789/
Industry & Partner Announcements
- AST SpaceMobile Partners With AT&T, Vodafone, Rakuten
(See company’s official press releases: https://ast-science.com/news/) - AST SpaceMobile Government Contracts and Developments
(See news updates on: https://ast-science.com/news/)
For any deep-dive investment or business decisions, always verify key data with the latest company filings and updates from these official and third-party sources.